New app allows users to visualize food insecurity data
By Diane Schanzenbach and Natalie Tomeh // Originally published by IPR
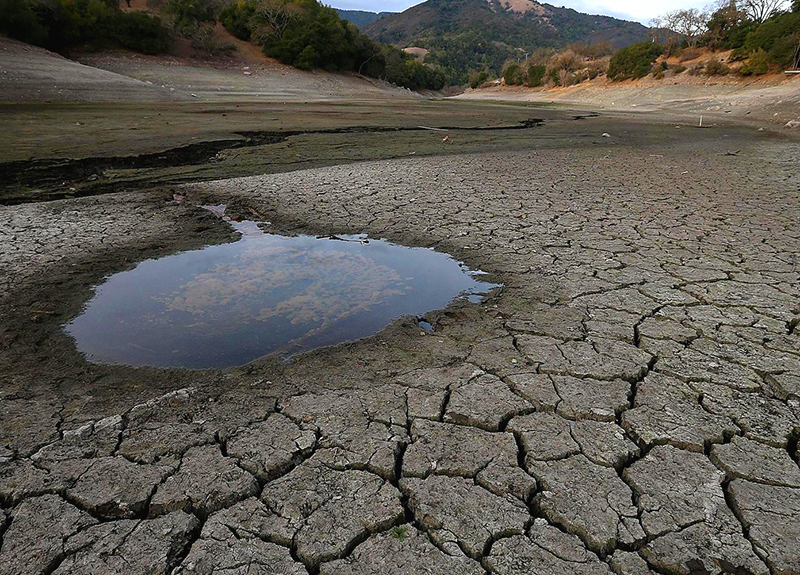
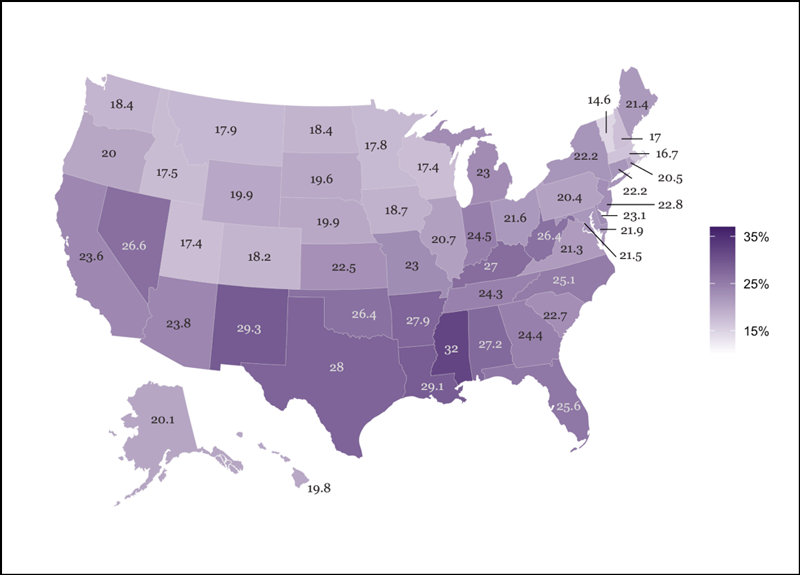
During the COVID-19 crisis, rates of food insecurity have soared. According to weekly data released by the U.S. Census Bureau’s Household Pulse Survey from April 23–June 30, 25.2% of all respondents and 29.6% of respondents with children reported experiencing conditions of food insecurity. As shown in the map (above), rates of food insecurity vary widely across states, ranging from a low of 14.6% in Vermont to a high of 32% in Mississippi.
Food insecurity also ranges widely by the respondent’s racial and ethnic group, ranging from 34.8% of Black respondents and 33.3% of Hispanic or Latino respondents, to 21.2% of White and 22.2% of Asian respondents. Rates vary for racial/ethnic groups within state as well.
To allow users to easily access food insecurity rates for different states and different racial and ethnic groups, we have created an app that allows users to graph weekly food insecurity rates, available here.
Note that we transform the Census Household Pulse Survey’s question on food sufficiency in the household to the more-familiar rate of food insecurity, as described in the “Notes on the Data” button on the app. The data are weighted at the respondent level and represent respondents’ reports about their household’s food security status.
Diane Whitmore Schanzenbach is the Margaret Walker Alexander Professor and IPR Director. Natalie Tomeh is a Northwestern undergraduate and an IPR Summer Undergraduate Research Assistant.