Northwestern earth and planetary scientists publish longest urban CO2 record
Every quarter that he lectured on climate change to his Earth 201: Earth Systems Revealed students, Northwestern earth and planetary sciences professor Andrew Jacobson got asked the same question: how do we really know where local CO2 is coming from?
Jacobson and Joel Moore, a geologist at Towson University and former Northwestern postdoc, set out to answer that question and pinpoint the role that urban areas play in CO2 emissions. Their findings are published in Elementa: Science of the Anthropocene.
“What we found was direct evidence that our activities in an urban area – driving, heating our houses, etc.—produce CO2 in Evanston,” says Moore.
The team compared the average CO2 concentration over Evanston in parts per million (ppm) to background sites that averaged 394 ppm, just shy of the widely reported global average of 400 ppm.
“Our study showed average CO2 concentration at 20 ppm higher than the concentration observed at background sites,” says Moore.
The team collected data continuously from August 2011 through February 2012, producing one of the longest continuous urban CO2 records reported thus far. The length of the study also allowed the scientists to observe urban CO2 cycling over seasons.
“In summer, the local ecosystem (plants along with soil microbes) and fossil fuel emissions contribute equally to the excess CO2 we see in Evanston compared to background sites, whereas in winter 80-90 percent of the excess CO2 comes from burning natural gas for heating homes and businesses,” says Moore.
The team’s work is the latest contribution to the growing study of urban metabolism, a framework for assessing sustainability by measuring total energy, materials, and waste products that flow in and out of an urban setting. Studies of urban metabolism inform policy for sustainable and resilient cities.
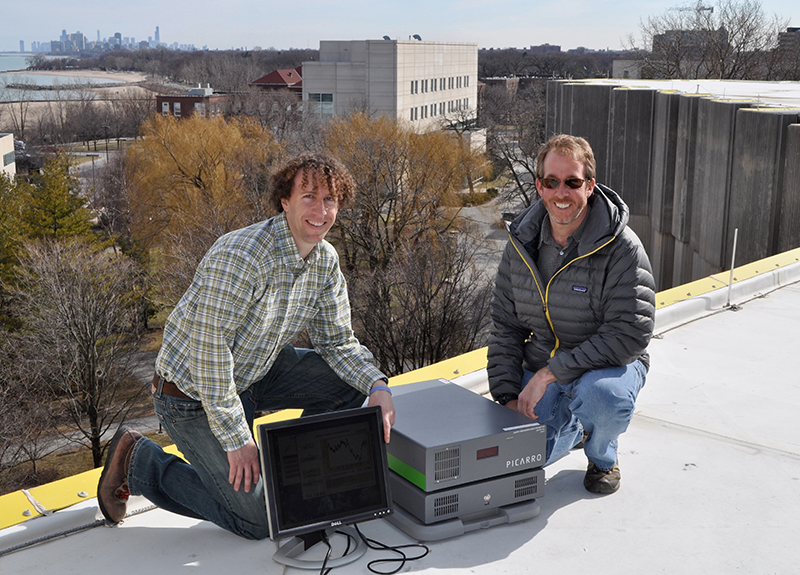
To produce their urban CO2 record, Jacobson and Moore acquired a device that could simultaneously measure the concentration of CO2 in the atmosphere and the carbon isotope composition of that CO2 in one shot. They installed the device on the roof of Northwestern’s Scott Hall and began taking samples for analysis. Back at the lab, they looked at the ratio of carbon isotopes in atmospheric CO2, in this case the ratio of carbon-13 to carbon-12, in each sample to determine the source of CO2.
“With this game-changing device, we’ve been able to take can collect 7-8 measurements per second, or more than 10,000 data points per day,” says Jacobson.
The team needed one more set of complementary data to complete the picture: wind speed and direction.
“When it’s quiet, there can be a buildup of CO2 from petroleum and natural gas combustion. Whether the wind is blowing over Evanston or blowing over Lake Michigan, that also makes a difference,” says Jacobson.
They plugged meteorological data from the Illinois Environmental Protection Agency’s wind station in Evanston into their analysis to paint a more complete picture of urban CO2.
Moore and Jacobson hope that the research will inspire similar projects and increase greater global awareness of human contribution to climate change. In the short run, Jacobson is looking forward to handing the study to his Earth 201 students in the spring.
This research was funded in part by an equipment award from the Institute for Sustainability and Energy at Northwestern (ISEN).