At 2:00 PM on August 14, 2003, approximately 50 million people lost electricity from the Midwest to New York City and up to Ontario. The reason? A high-voltage power line in Ohio brushed against some overgrown trees and shut down causing cascading blackouts throughout the region. Disruptions like this are not only inconvenient, but they can also inflict tens of billions of dollars in losses and are a hazard to public safety.
Until now, there has been little information on why small, localized electrical failures, which are generally inconsequential, can sometimes disrupt large portions of the power grid like the one that occurred in 2003. But, in an effort to better understand and predict cascading power outages, a team of researchers from Northwestern has just released the most comprehensive analysis of its kind.
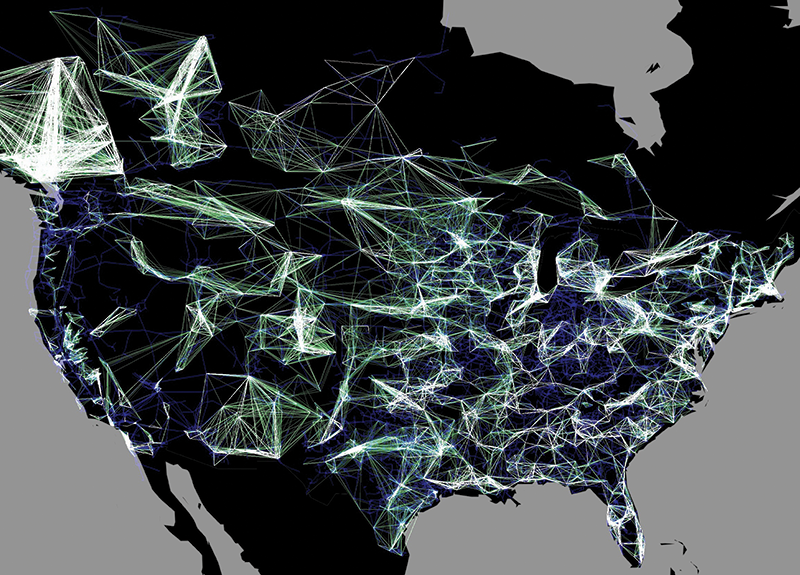
In their article published in the journal Science, Yang Yang, Takashi Nishikawa, and Adilson E. Motter examine the US–South Canada power grid, which is the largest contiguous power grid in the world that is amenable to modeling. This large grid is broken up into three large connected networks (Texas Interconnection, Western Interconnection, and Eastern Interconnection) that operate fairly autonomously (see sidebar figure). For each of the three interconnections, the researchers analyzed power generation, transmission, and consumption data spanning the years 2008 to 2013. The data, which is reported regularly to the Federal Energy Regulatory Commission (FERC), covered multiple seasons as well as both on- and off-peak demand levels, which correspond to different operating conditions for the grid.
“Our study is the first to simultaneously account for the physics of power line failures, the real data on the entire contiguous US power grid, and the diversity of its operating conditions,” says Motter, Charles E. and Emma H. Morrison Professor of Physics and Astronomy at Northwestern. “We need a study of this scale for correct assessment of risks of large cascades that can inform grid design and operation.”
Their paper, titled “Small vulnerable sets determine large network cascades in power grids,” estimated the probability that each transmission line would fail in a cascading blackout and produced a system-wide vulnerability map (see sidebar video).
In their analysis of over 100,000 power lines, the researchers found that the parts of the network likely to cause cascading blackouts under any of the conditions considered totaled only about 10.8 percent when all of the model’s scenarios are taken into account. “This is surprisingly small given that no two cascades are identical,” says Nishikawa, Research Associate Professor in Northwestern's Department of Physics and Astronomy. “And by considering multiple operating conditions, we can in effect answer the question of why seemingly identical perturbations may lead to a large blackout in some cases and no blackout at all in others.”
These findings will likely be a big help to grid operators and policy makers as they decide when, where, and how much to invest in the electric grid to ensure outages like the one that occurred in 2003 never happen again.
**
This research was made possible due to support from the Institute for Sustainability and Energy at Northwestern (ISEN), US National Science Foundation, and US Department of Energy's Advanced Research Projects Agency-Energy (ARPA-E).
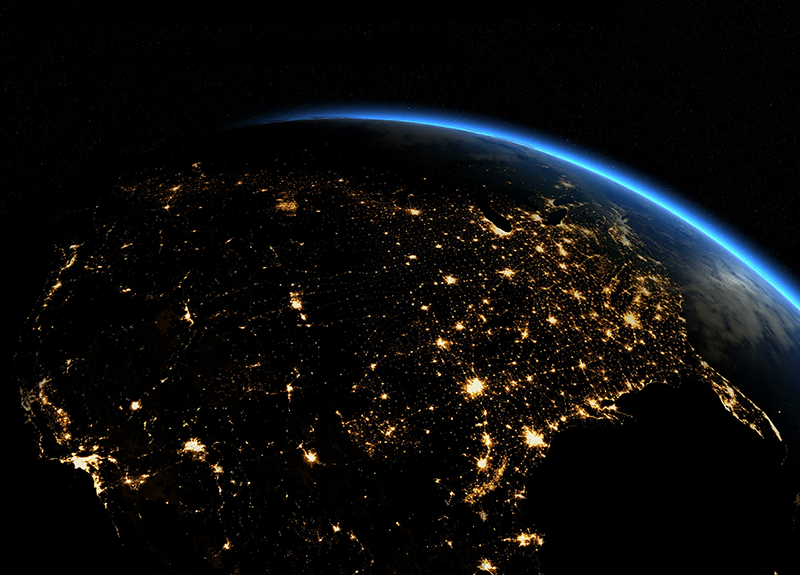
Image credit: NASA